Disclosure Partner links are marked. We may earn a commission if you use one. It costs you nothing extra and never changes our verdict. How we review
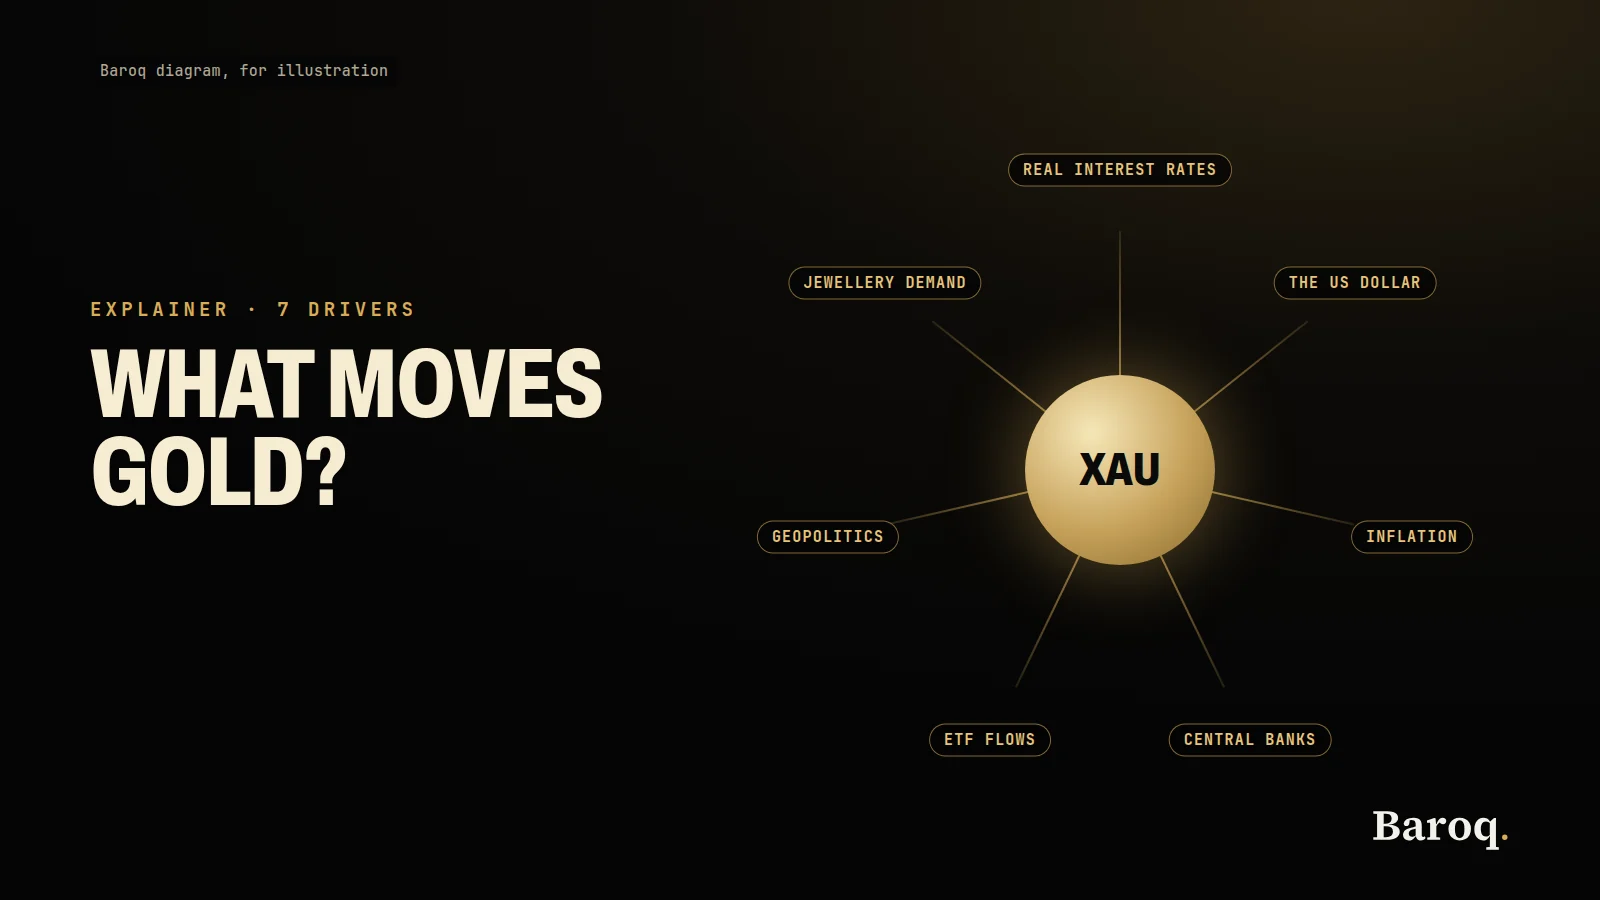
What moves the gold price is seven drivers at once: real interest rates, the US dollar, inflation expectations, central-bank buying, ETF and investment flows, geopolitical risk, and jewellery, industrial demand and supply. The Federal Reserve, the World Gold Council, the IMF and the BIS publish the definitions and the quantities. Every figure below is taken from a page opened on 10 November 2026. The live price is on Baroq Markets.
What moves the gold price?
Real yields first, then the dollar, official buying and ETF flows, with geopolitics, jewellery, industry and supply on top.
A useful way to hold the seven drivers is to split them into the price of money, the unit of account, and the tonnes that change hands.
The price of money is the real interest rate, and the inflation expectations that sit inside it. The unit of account is the US dollar, because the screen price of gold is a dollar price. The tonnes are central banks, ETFs and bars and coins, jewellery, industry, and the mines and recyclers that supply them. Geopolitical risk cuts across all three: it can change the convenience of holding an asset with no issuer, and it can change the rates and the dollar at the same time.
The IMF's July 2026 note on gold in central bank reserves, written by Istvan Mak and Etienne Vaccaro-Grange, names the same three channels in reserve-manager language. Gold pays no dividend, so its price is sensitive to real interest rates, which are the opportunity cost of holding it instead of a safe interest-bearing asset. It has a convenience yield from being a store of value with no issuer and no counterparty. And because it is priced in US dollars, the quoted price moves with the external value of the dollar. The rest of this page walks through each driver with the document that supports it.
| Driver | What an official source says | A figure checked on 10 November 2026 |
|---|---|---|
| Real interest rates | The Fed calls TIPS yields real yields, because principal and coupons adjust with the CPI. | Definition on the Board's TIPS yield-curve page. |
| US dollar | H.10 calls the broad index a weighted average of the dollar's foreign-exchange value. | 121.8803 on 6 November 2026, January 2006 = 100. |
| Inflation expectations | Inflation compensation is the gap between nominal yields and TIPS yields. | The Board says it also contains risk premiums. |
| Central-bank buying | Gold has no issuer. The recent share of reserves rose mostly because the price rose. | IMF: 26.2 percent of international reserves in 2025. WGC: 321 tonnes bought in Q3 2026. |
| ETF and investment flows | Physically backed funds and bars and coins are separate lines in the demand table. | ETFs added 211 tonnes in Q3 2026. Bars and coins were 268 tonnes, 19 percent lower than a year earlier. |
| Geopolitical risk | The link with gold returns is stronger when financial conditions are loose, in one BIS study. | The IMF note finds the tail-event result unreliable after the pandemic. |
| Jewellery, industry, supply | High prices cut jewellery tonnes. Mine output moves slowly. Recycling did not jump with the price. | Jewellery consumption 313 tonnes. Mine production 1,071 tonnes. Recycling 314 tonnes. |
How do real interest rates change the cost of holding gold?
Gold pays no dividend and no coupon. A Treasury inflation-protected security does. That difference is the first driver.
The Federal Reserve's page on the TIPS yield curve and inflation compensation explains the instrument in plain terms. The US Treasury issues TIPS alongside ordinary notes and bonds. The principal and the coupon payments on TIPS are adjusted for inflation, measured by the change in the consumer price index between issuance and the payment. Because the future inflation rate is unknown, the dollar amount of those payments is uncertain: higher inflation means a higher dollar payment. The Board writes that TIPS are riskless in real terms, as opposed to nominal terms, and that yields on TIPS are often thought of as real yields.
A real yield is the yield after that inflation adjustment. When it is higher, the investor who holds gold instead of TIPS gives up more income. When it is lower, the income given up is smaller. Mak and Vaccaro-Grange put the same point on the reserve-asset side: the opportunity cost of a non-yielding asset falls when long-term yields fall, and gold's negative correlation with the 10-year US yield is the most stable finding across the periods in their note. They also find that gold has benefited, after the global financial crisis, when short rates fall, because a lower short rate reduces the opportunity cost of a zero-yield asset.
Joachim Nagel made the historical version of this point in a speech the BIS published from the Global Precious Metals Conference in Sorrento on 5 October 2026. Once gold ceased to anchor the monetary system, holding it became more costly relative to government securities, which in the 1980s and 1990s offered yields. After the global financial crisis, he said, expansionary policy and asset purchases lowered the overall level of interest rates, and that lowered the opportunity cost of holding gold. He also notes the turn the other way: a recent rise in government bond yields has made debt securities relatively more attractive again, while higher debt has raised concern about the credit of those same securities.
Two limits belong next to the mechanism. The Board's TIPS page says the fitted curve is a staff research product, not an official statistical release, and that it can be revised. And a real yield is not a promise about the gold price next month. It is the income a holder of gold is not receiving today. A shorter walk through the same idea is on gold and interest rates.
Why does the US dollar show up in the gold price?
The gold price on a wholesale screen is a dollar price per troy ounce. A move in the dollar changes what that number means for a buyer who earns another currency, and it changes the number itself.
Mak and Vaccaro-Grange state the mechanical part directly: as gold is priced in US dollars, its quoted price moves with the external value of the dollar. They also call gold a partial hedge against US dollar depreciation, and they separate that from the real-rate channel. The two can pull in different directions in the same week. A weaker dollar can lift the quoted gold price even while real yields are little changed. A stronger dollar can lean on it even while official buyers are still adding tonnes.
The Federal Reserve measures that external value in the H.10 release. The 9 November 2026 weekly release describes the broad dollar index as a weighted average of the foreign-exchange value of the US dollar against the currencies of a broad group of major US trading partners. Two narrower indexes cover advanced foreign economies and emerging market economies. The base is January 2006 equals 100. On the release opened for this page, the broad index stood at 121.8803 on 6 November 2026.
The weights are not a secret formula from a chart vendor. A Board FEDS Note of 15 January 2019, "Revisions to the Federal Reserve Dollar Indexes," sets out the method still behind those indexes. Daily changes are geometrically weighted averages of bilateral exchange-rate changes. The weights use bilateral trade in goods and services. The note says the Board excludes trade in oil, gold and military equipment from that computation, because exchange-rate moves usually have little effect on trade in those goods. Gold is left out of the weights on purpose. The index is a measure of the dollar against trading partners, and it is not a gold index with the metal counted twice.
A stronger dollar and a higher gold price can still arrive together. The IMF note's point is that the dollar channel is one of three, and the other two can dominate it. For a shorter note on the same relationship, see gold and the dollar index.
Do inflation expectations move gold by themselves?
People often treat gold as an inflation hedge and stop there. The official pages draw a narrower line.
On the Board's TIPS page, inflation compensation, also called breakeven inflation, is the gap between the fitted nominal Treasury yield and the fitted TIPS yield of the same maturity. It is the inflation rate at which the two securities would deliver the same return. If actual inflation comes in higher than that rate, TIPS end up ahead of the nominal bond. If it comes in lower, the nominal bond ends up ahead. The Board writes that inflation compensation serves as a gauge of investors' inflation expectations, and that risk premiums can drive it as well.
That gauge is not the same thing as last month's consumer price index, and it is not, by itself, a gold signal. Mak and Vaccaro-Grange look at gold's correlation with US inflation surprises and find it predominantly negative, with the exception of the years between the global financial crisis and the start of the pandemic. Their reading is that gold does not provide a consistent hedge against inflation shocks. It has tended to rise on an inflation surprise when real rates stay low, and to fall when the surprise is accompanied by higher real rates, or when investors expect higher real rates to follow. They point to later studies that find movements in real interest rates a stronger explanation of the gold price than inflation itself.
The practical order is the one in their three channels. An inflation surprise matters for gold when it changes the real yield, or when it changes the convenience of holding an asset that cannot be printed. A hot price index that leads the market to expect higher real yields is a different event from a hot price index that the market treats as temporary. The CPI release and the breakeven are both worth reading. Neither one replaces the other. More on the consumer price index and gold is in gold and inflation.
Why do central banks buy gold?
Central banks hold gold because it is no one's liability. They also hold it because they already hold it. Both facts are in the documents, and they answer different questions.
The IMF defines monetary gold as gold owned by monetary authorities, or by others under their effective control, and held as a reserve asset. It includes bullion, coins, ingots or bars, with a purity of at least 995 parts per 1,000, including allocated accounts and certain unallocated accounts with non-residents that give title to delivery. Other gold is treated as a commodity.
Nagel's speech sorts the modern history into three chapters. Gold anchored Bretton Woods, then lost share during the decades of deeper trade and bond markets, then returned as a purchase after the global financial crisis, especially for China and Russia in his telling. He is explicit about the yield: gold pays no interest, it entails storage costs, and it offers no positive yield unless its price rises. The appeal, in his account of the years since the late 2010s, is that gold has often functioned as a safe-haven asset in stress, and that financial sanctions have been an additional reason to buy. Foreign securities and deposits can be frozen. Physical gold held domestically is not subject to the same risk.
The tonnes and the share of reserves are different statistics, and mixing them is how a large price rise gets told as a large buying boom.
The World Gold Council's Gold Demand Trends for the third quarter of 2026, dated 3 November 2026, puts central-bank and other official-institution demand at 321 tonnes in the quarter. That was 42 percent higher than a year earlier, and it lifted year-to-date demand to 675 tonnes, 6 percent higher than the same stretch of 2025. The Council's press release the same day says diversification and risk management remained the primary drivers of that official demand, and that 321 tonnes was the highest quarterly total since the fourth quarter of 2024.
The stock of ounces in reserves has not jumped by anything like the jump in value. The IMF's Annual Report 2026, Appendix I, says the share of gold in international reserves was 26.2 percent in 2025. The physical stock of official gold increased by 0.8 percent that year: 2.1 percent higher in emerging and developing economies, and unchanged in advanced economies, which still hold about two-thirds of the stock. At the end of 2025, gold was 34.3 percent of the reserves of advanced economies and 18.9 percent of the reserves of emerging and developing economies. The market value of gold held by monetary authorities rose 58.8 percent in 2025, to 3.7 trillion SDR. The dollar, measured inside foreign-exchange reserves and not inside that gold share, was still about three fifths of foreign-exchange reserves, at 57 percent.
The July IMF note looks at a longer window and reaches the same split. The share of monetary gold on central bank balance sheets went from 10 percent of reserves in January 2019 to over 22 percent by August 2025, and the note says the price was the primary driver. Between 2018 and 2025, the market value of those holdings rose by about 3.2 trillion dollars, from roughly 1.2 trillion to 4.5 trillion, an increase of 268 percent, while the volume of gold held rose by about 8.5 percent. Nagel's speech gives a similar counterfactual for a shorter window: from 2023 to 2025 the gold share of global reserves jumped to almost 25 percent, and had prices stayed at their 2023 levels the share would have fallen from 14 percent to 12 percent.
Read the 321 tonnes and the 26.2 percent as answers to different questions. One is how many tonnes the official sector added in a quarter. The other is how much of the reserve pile, marked at the market price, gold now represents. A higher price raises the second number even when the first is modest.
How do ETF and investment flows reach the price?
Investment demand in the Council's table is not one blob. Bars and coins are metal a person can take delivery of, or store in an allocated account. Exchange-traded funds and similar products are shares that hold metal for the shareholder. Over-the-counter and other demand is the residual the Council uses for less visible investment, and the press release says it is estimated rather than observed directly.
In the third quarter of 2026 the lines diverged.
Gold ETFs added 211 tonnes, reversing the outflow of the second quarter. The quarterly table shows 211.2 tonnes, against 225.7 tonnes in the third quarter of 2025, which is why the Council describes the inflow as 6 percent below that earlier quarter. The press release says holdings rose to 4,256 tonnes, a record on their count. Louise Street, senior markets analyst at the Council, said the inflow came with geopolitical risk and concerns around fiscal discipline on the institutional side, while retail buyers held back because the price lacked a clear direction.
Bar and coin demand was the retail side of that sentence. It was 268 tonnes, 19 percent lower than a year earlier. The table's tenth is 267.8 tonnes. The Council's highlights say buyers waited for a clearer price trend. China was the outlier in the press release, with bar-and-coin demand up 7 percent on the year. This page does not split the other countries, because the country pages were not the source used for the total.
Over-the-counter and other demand was 143.5 tonnes in the table, and the press release rounds the year-earlier comparison as 143 tonnes against 101 tonnes. The footnote is worth keeping: that line includes a statistical residual. It is not a count of tickets.
Flows of this size can move the price inside a quarter because the fund has to buy or sell metal when shares are created or redeemed. They can also reverse. The second quarter of 2026 in the same table was an outflow of 47.3 tonnes from ETFs, and the third quarter was a large inflow. A single quarter is a description, not a run rate to copy forward. The Council's own outlook sentences are left out of this page on purpose.
Does geopolitical risk make gold a safe haven?
It can, and the official research refuses a blanket yes.
Nagel's speech says gold has often functioned as a safe-haven asset during economic, financial and geopolitical stress, and he pairs that with the sanctions point already covered: a security issued by someone else can be frozen, and domestic physical gold cannot, in the same way. That is a statement about why a reserve manager might buy. It is not a statement that every headline lifts the price.
The BIS working paper "Chasing El Dorado," by Rafael Guerra and Gabriel Zelpo, number 1380, dated October 2026, studies the question with monthly data from 1990 to 2026. The authors' views are their own, as the BIS cover states. They find that increases in geopolitical risk, both threats and realised events, are associated with higher gold returns, and that the association is stronger when financial conditions are loose. They split the relationship into a credit and liquidity channel and an opportunity-cost channel, and they find the first of those clearer than the second. They also write that the largest impact in their results shows up when loose financial conditions and geopolitical escalations coincide, as in 2024 to 2026.
The IMF note, reading a different set of correlations, is more cautious about the tail. It says gold's protection against equity downturns, inflation surprises and geopolitical shocks has weakened considerably since the pandemic, and that the evidence they review does not show reliable safe-haven properties in tail events. Gold carries no credit risk, and it can act as protection against sanctions, and it is still volatile. The note's advice to reserve managers is to treat it as a high-risk reserve asset and to keep it out of the liquidity tranche, because it is less useful than its headline value when the need is to sell quickly.
Hold those three documents side by side. A reserve manager can buy gold because it has no issuer. A statistical study can find higher gold returns after geopolitical shocks, especially when funding is easy. And the same metal can fall with other assets in a tail event, which is what the IMF authors report for the years since the pandemic. A week in which gold drops during a crisis is inside that research. It is not a broken law of nature.
What do jewellery, industry and supply do?
Jewellery, electronics and mines move more slowly than a real-yield print, and they still decide a large share of the tonnes.
The Council's third-quarter highlights, with the table underneath, are the source for this section. Jewellery consumption was 313 tonnes, 17 percent lower than a year earlier, and the weakest third quarter in the Council's data series. The table records 312.9 tonnes against 376.4 tonnes. The value of that demand edged up 2 percent, to 43 billion dollars, because the price was higher. Consumers, the Council writes, kept moving toward lighter and lower-carat pieces. Fabrication, which includes stock sitting with the trade, was 340.1 tonnes, 19 percent lower than a year earlier.
Technology demand went the other way in tonnes. It rose 3 percent, to 84.8 tonnes in the table, which the press release rounds to 85 tonnes and calls the highest quarterly total since the fourth quarter of 2021. Electronics were 72.5 tonnes, up 5 percent, and the Council attributes the rise to manufacturing tied to artificial intelligence, which more than offset the limiting effect of the high gold price. Dentistry was 1.9 tonnes. Other industrial uses were 10.4 tonnes. These are small beside jewellery, and they are real demand that does not vanish when investors are looking at yields.
Supply did not surge to meet the price. Mine production was 1,070.9 tonnes, up 3 percent on the year, and the highlights call 1,071 tonnes a third-quarter record. The same table prints net producer hedging at minus 16.8 tonnes. Recycled gold was 314.5 tonnes, down 8 percent on the year, and the highlights call 314 tonnes a three-year low. Total supply was 1,368.6 tonnes, 1 percent lower than a year earlier, matching total demand including the over-the-counter line at 1,369 tonnes in the rounded highlights. The average LBMA afternoon price in the quarter was 4,262.2 dollars an ounce in the table. The highlights round it to 4,262 dollars and say it was 23 percent higher than a year earlier, and the third-strongest quarterly average on the Council's record.
The pattern is the slow driver. A high price reduced jewellery tonnes and did not produce a rush of scrap. Mine output rose by a low single-digit percentage. That is why a quarter's price can be set by real yields, the dollar and fund flows, while the jewellery and mine numbers explain the tonnes underneath rather than the move on a given afternoon.
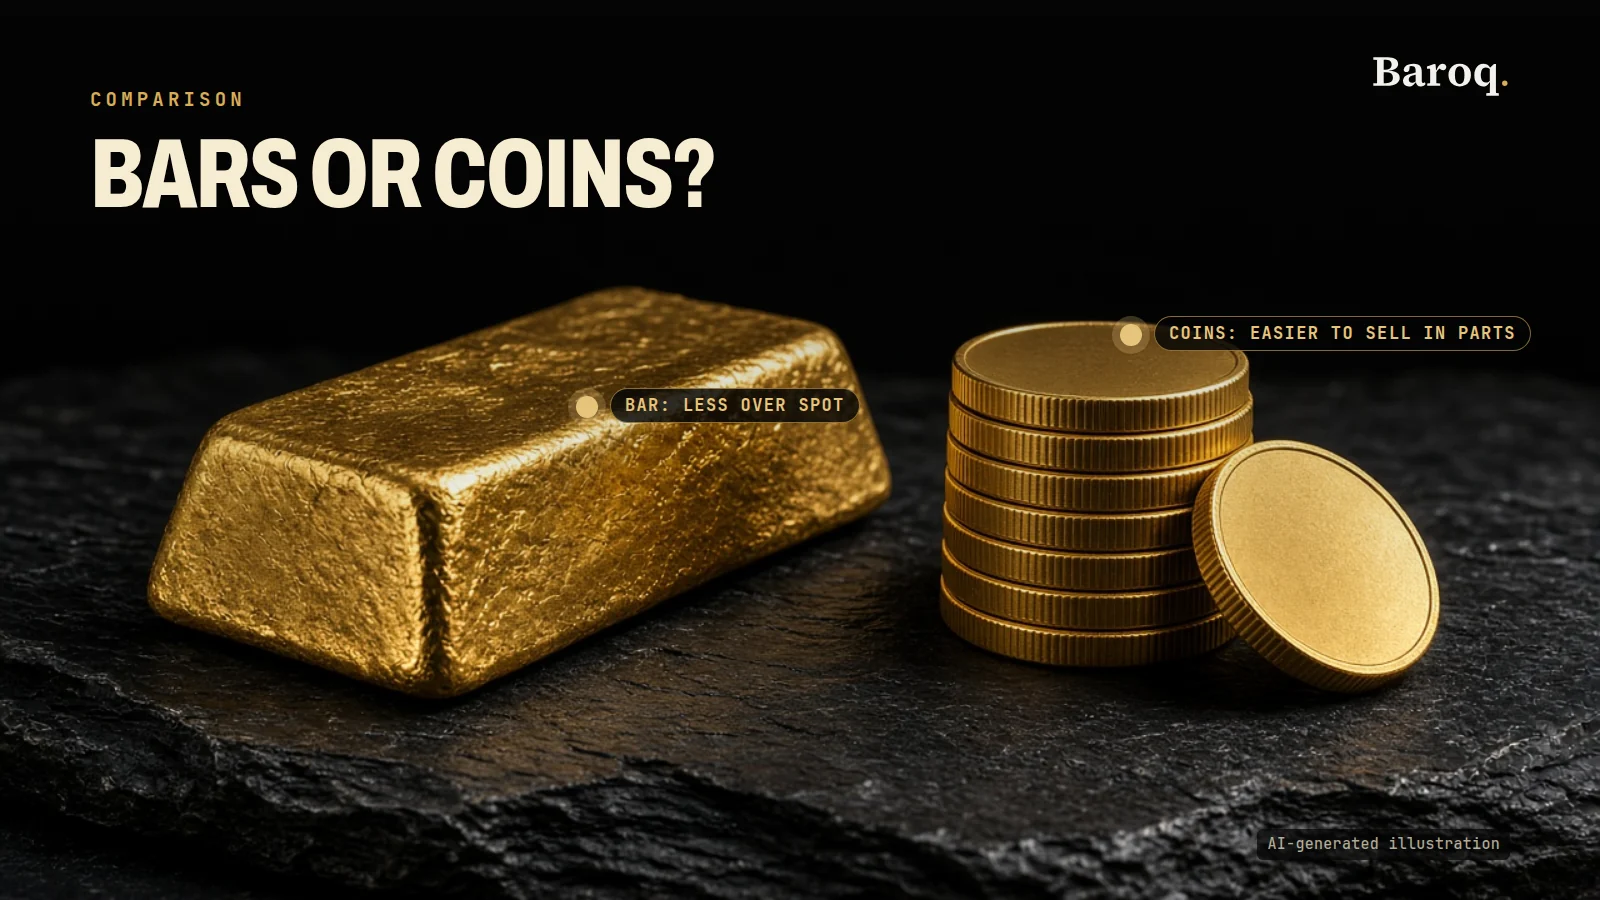
Anyone comparing a bar, a coin and a fund share still has to deal with the premium, the buy-back and the storage. Those are covered in how to buy physical gold, gold bars vs gold coins and gold vs silver. Silver's industrial share is a different metal's story. It belongs in that comparison, not in this gold table.
Which driver matters on a given day?
Start with the real yield, because that is the link the IMF note calls the most stable, and because gold still pays nothing. Then read the dollar, because the quote is a dollar quote and the Board publishes a trade-weighted index every week. Then look at the tonnes only when a quarter, or a month of fund data, is actually out. A single geopolitical headline sits on top of those, and the BIS paper says the gold response has depended on whether financial conditions are loose.
A day with an inflation release is a day to check inflation compensation and the real yield, not the headline price index alone. A day with a large fund creation is a day the ETF line can matter more than jewellery. A quarter in which official buyers add 321 tonnes is a quarter in which the stock of reserves changes by that amount, while the share of reserves can still be a valuation story, as the IMF accounts show for 2025.
The seven drivers are observable. They are not a ranking that stays fixed, and they are not a schedule of the next move. The price on the screen today is on Baroq Markets.
Where were these figures checked?
Each source below was opened on 10 November 2026. If a publisher revises a table, the publisher's page wins.
- Federal Reserve Board, TIPS Yield Curve and Inflation Compensation. Defines TIPS, real yields and inflation compensation. The explanatory page shows a last update of 29 July 2022 and says the series is a staff research product.
- Federal Reserve Board, Foreign Exchange Rates, H.10, release date 9 November 2026. Broad index 121.8803 on 6 November 2026, January 2006 = 100.
- Federal Reserve Board, FEDS Note, Revisions to the Federal Reserve Dollar Indexes, 15 January 2019. Trade weights, and the exclusion of oil, gold and military equipment.
- World Gold Council, Gold Demand Trends: Q3 2026, 3 November 2026, data as of 30 September 2026. The quarterly table is the source for the tenths of a tonne. Metals Focus, Refinitiv GFMS and ICE Benchmark Administration are named on the table.
- World Gold Council, press release, Central bank buying and ETF inflows support gold demand in Q3, 3 November 2026. The 4,256 tonne ETF holding and the analyst comment are from this release.
- IMF, Annual Report 2026, Appendix I, International Reserves. Gold's 26.2 percent share, the 0.8 percent rise in the physical stock, and the 57 percent dollar share of foreign-exchange reserves.
- IMF Note 2026/007, Mak and Vaccaro-Grange, Gold in Central Bank Reserves, July 2026. The three channels, the real-yield correlation, the inflation-surprise result, and the 2018 to 2025 valuation split. The views are the authors'.
- BIS, Joachim Nagel, Shifting ground, speech of 5 October 2026. Gold pays no interest, the sanctions point, and the 2023 to 2025 share of reserves.
- BIS Working Papers No 1380, Guerra and Zelpo, Chasing El Dorado, October 2026. Geopolitical risk and gold returns, conditional on financial conditions. The views are the authors'.
The drivers are public. The desk, the research tools and the calculators are the product. For those, See plans.
Join the free Telegram channel: https://t.me/baroqtech
Educational content, not financial advice. Prices, fees and offers change: check them on the provider's own site before you sign up. Trading leveraged products carries a high risk of losing money, and you can lose all of it.