Disclosure Partner links are marked. We may earn a commission if you use one. It costs you nothing extra and never changes our verdict. How we review
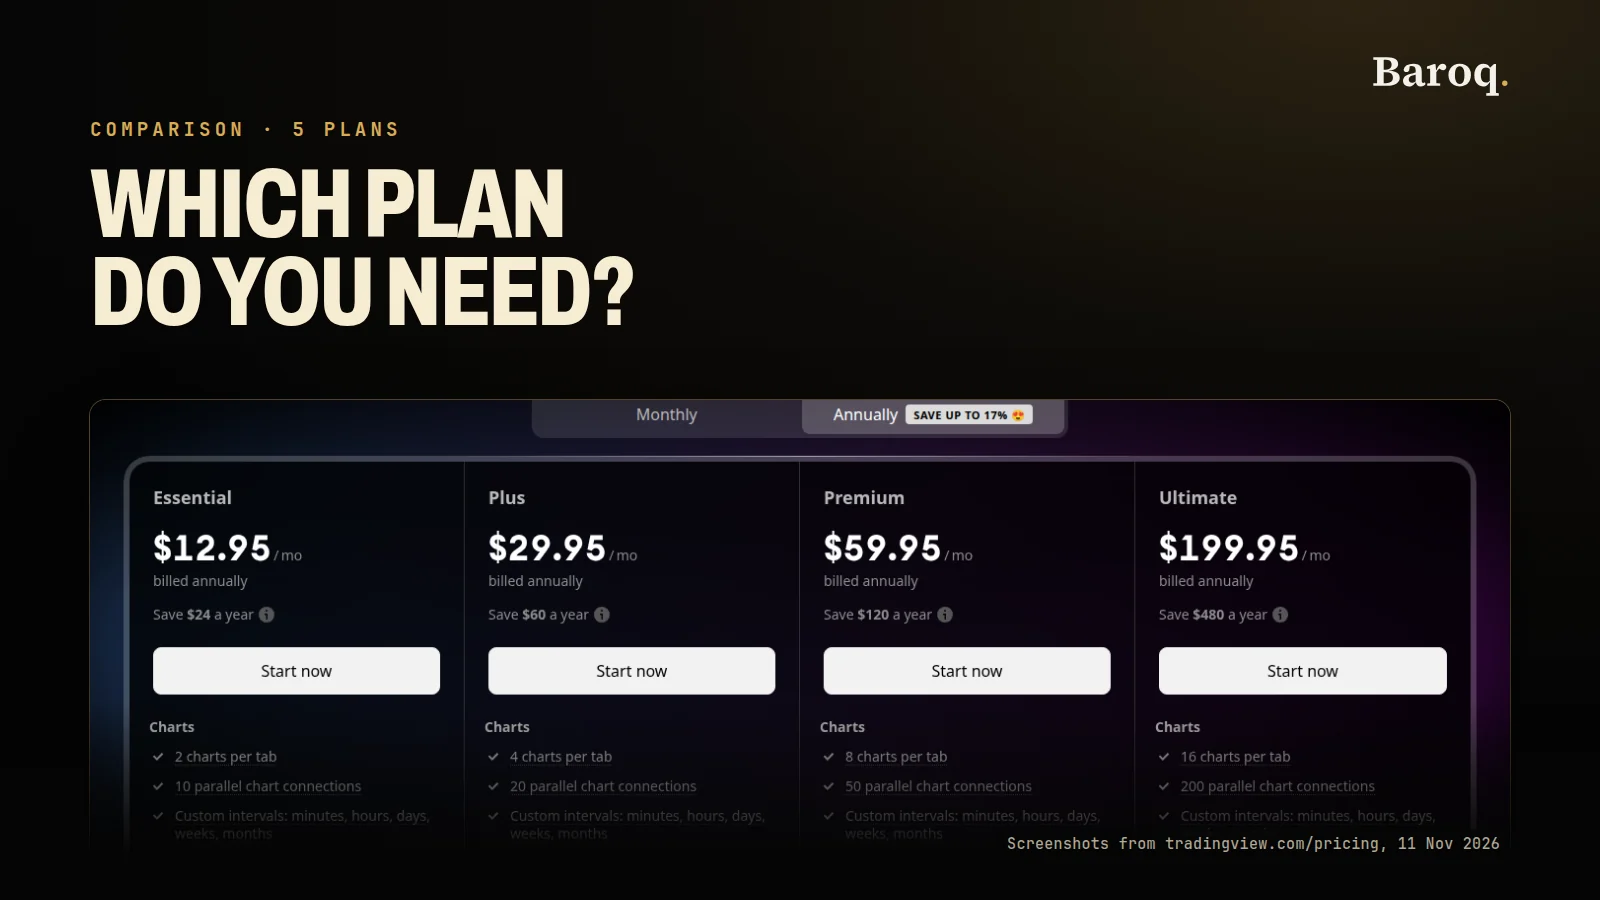
TradingView plans, read on the pricing page on 10 November 2026, are five: Basic at $0, then Essential, Plus, Premium and Ultimate. Basic is the free plan, with one chart in a tab and two indicators. The paid plans raise the chart, indicator and alert limits, take ads off the charts, and open longer intraday history. The prices on the cards that day were the annual rates, because Annually was the button that was checked.
Side by side
| Basic | Essential | Plus | Premium | Ultimate | |
|---|---|---|---|---|---|
| Special price shown, Annually selected | $0 | $12.95 a month | $29.95 a month | $59.95 a month | $199.95 a month |
| Full year if billed annually | $0 | $155.40 | $359.40 | $719.40 | $2,399.40 |
| A year of monthly payments, as the note states it | $0 | $179.40 | $419.40 | $839.40 | $2,879.40 |
| Charts per tab | 1 | 2 | 4 | 8 | 16 |
| Indicators per chart | 2 | 5 | 10 | 25 | 50 |
| Active price alerts | 3 | 20 | 100 | 400 | 1,000 |
| Alert duration on the table | 1 month | 2 months | 2 months | Infinity sign | Infinity sign |
| Minute history in bar replay | Not on this plan | 180 days, with a scaled hint | 365 days, with a scaled hint | All stored intraday data | All stored intraday data |
| Second-by-second history | No | No | No | All, from August 2022 | All, from August 2022 |
| Ads on charts | Yes, ad-free is off | No | No | No | No |
| Saved chart layouts | 1 | 5 | 10 | Infinity sign | Infinity sign |
| Native multi-monitor support | No | Yes | Yes | Yes | Yes |
- BasicOne daily chart, two indicators, and no fee.
- EssentialA swing trader who wants a second chart, five indicators, alerts and no ads.
- PlusIntraday work on four charts, with preset second bars and a longer minute history.
- PremiumSecond-by-second history, eight charts, and alerts marked with no expiry.
- UltimateSixteen charts, custom second bars, or seven days of tick data.
TradingView plans on the page today
The pricing page opens with a free tier and four paid cards. The free card says $0 forever, and the text under the sign-up button says no credit card is needed. The comparison table under the cards names that column Basic. This post uses Basic for the free plan and the four names on the paid cards: Essential, Plus, Premium and Ultimate.
The billing control has two buttons, Monthly and Annually. On the page as it loaded, Annually was the checked button, and it carried a badge that read "Save up to 17%". Each paid card then showed a line the page labels "Special price", followed by a per-month figure. A note on each card, shown as the title of that price, states the full annual amount and what a year of regular monthly payments would come to. Those notes are the price record for this post. Every dollar figure below is from that page on 10 November 2026. If a figure was not printed there, it is not filled in here.
A features page sits beside the pricing page. It describes tools in general: up to 16 charts, custom intervals, bar replay, alerts, and a large indicator library. It does not say which plan includes which limit. Where the two pages use different words for the same idea, both wordings are given, and the plan-by-plan numbers come only from the pricing table.
Whether paying for a chart package is worth it is a short question with a long answer, and a review would be a different page. The choice settled here is which plan's limits match the bars you use. The fee is a number on a card. The gold market is a different number, and it moves on its own.
The partner link in this comparison is TradingViewPartner. That link is an affiliate link. We may earn a commission if you use it. It does not add to the price you pay, and it does not change the limits above. The two TradingView pages in the source list at the end open through the same partner link.
How much does TradingView cost per month and per year?
On 10 November 2026, with Annually selected, Essential, Plus, Premium and Ultimate showed special prices of $12.95, $29.95, $59.95 and $199.95 a month, and the card notes put the full years at $155.40, $359.40, $719.40 and $2,399.40.
With Annually selected, the four paid cards showed these special prices:
| Plan | Special price on the card | Full year in the note | Year of monthly payments in the note |
|---|---|---|---|
| Basic | $0 | $0 | $0 |
| Essential | $12.95 a month | $155.40 | $179.40 |
| Plus | $29.95 a month | $359.40 | $419.40 |
| Premium | $59.95 a month | $719.40 | $839.40 |
| Ultimate | $199.95 a month | $2,399.40 | $2,879.40 |
The gap between the two yearly figures on each note is $24.00 on Essential, $60.00 on Plus, $120.00 on Premium and $480.00 on Ultimate. The badge says the saving goes up to 17 percent. It does not print a separate percent on each card. The largest dollar gap is Ultimate's. 480 divided by 2,879.40 is 16.7 percent, in line with the badge that says the saving goes up to 17 percent. The smaller gaps are a smaller share of those plans' monthly-payment totals. This post leaves them in dollars.
The annual view does not print a second sticker such as a lone monthly price on the card. It prints the cost of a year of regular monthly payments, in the note. Dividing those four notes by 12 gives $14.95, $34.95, $69.95 and $239.95. That is arithmetic on the notes, not a price label that was showing while Annually was selected. The page data behind the Monthly button carries the same four amounts. They are recorded here as that division, and as the data the toggle uses, so a reader can see where $179.40 comes from. They are not quoted as a sticker that was on the annual card.
Basic has no yearly note because the card is $0.
A few billing rules sit in the questions at the bottom of the same pricing page.
You can cancel, and the subscription does not renew itself after the term you have paid. The paid service stays on for the rest of that term. A trial that you cancel stops at once. The answers do not say how many days a trial lasts, so this post does not invent a trial length.
Refunds, on that page, are for annual plans and have to be requested within 14 calendar days of payment. The same answer says there are no refunds for a move up to a more expensive plan, for monthly plans, or for market data, including when the cancellation is the same day as the payment. A reader who wants the option of those 14 days is looking at the annual bill, not the monthly one. A reader who wants to stop the next charge without that window is looking at the monthly bill, and the page says that monthly charge is not refunded.
An annual plan can be moved up without a new charge at the moment of the change. The page says the days left on the current plan are converted into days of equivalent value on the higher plan, the remaining period shortens, and the next payment date moves. A move down waits. The current plan stays as it is until its date, and the lower plan starts when that term ends, at the rate selected for it.
The page lists cards, PayPal, Apple Pay and crypto as acceptable ways to pay, and says the mobile apps can also use the payment methods of the app stores. Crypto is described as available for monthly and annual plans, processed by Triple-A, with a Crypto tab on the order page. None of that changes the dollar amounts in the table above.
The prices are the US dollar amounts on the page as it loaded. The page can show other currencies. Those other currencies were not the figures on the load used for this post, so they are not copied in. The "Special price" label is TradingView's own label on that date. It is not a claim that the same dollars will be on the card next month. Read the pricing page again on the day you pay.
Charts, indicators and saved layouts
Charts per tab, on the comparison table, are 1 on Basic, 2 on Essential, 4 on Plus, 8 on Premium and 16 on Ultimate. The hint on that row says several charts in one tab let you compare markets, symbols and timeframes, and sync the symbol, the interval, the drawings and the crosshair. The features page says "up to 16 charts per screen" and mentions synchronized symbols, timeframes and drawings. Sixteen is the Ultimate cell. The features page does not attach the lower counts to named plans. The pricing table does.
A second limit sits beside charts per tab and is easy to mix up with it. Parallel chart connections are 2, 10, 20, 50 and 200 across Basic, Essential, Plus, Premium and Ultimate. The hint says this is how many charts can stay open at once across tabs. When the limit is reached, the oldest open chart closes to make room. A trader with one tab of four charts is using the "charts per tab" row. A trader with many tabs, or with charts left open from earlier in the day, is also using the parallel-connections row. On Basic that second number is 2. Two monitors do not raise it. The desktop app's multi-monitor row is a third, separate line, and it is covered further down.
Indicators per chart are 2, 5, 10, 25 and 50. The hint says a chart can hold built-in and community indicators together. The table also says "400+ pre-built most popular indicators" and "150K+ community-powered indicators" are available on every plan, including Basic. The features page says "400+ built-in indicators and strategies" and "100,000+ public indicators". Both pages were opened on 10 November 2026. They do not use the same count for the public library. This post does not pick one and discard the other. The practical limit for a free chart is the "2" in the indicators-per-chart cell, not the size of the library behind it.
Indicators on indicators are a different cell: 1 on Basic, 1 on Essential, 9 on Plus, 24 on Premium and 49 on Ultimate. Essential raises how many indicators you can place, from 2 to 5, and leaves the stack depth at 1, the same as Basic. A reader who wants one indicator calculated on another indicator, the example in the hint being RSI on a moving average, does not get that extra depth on Essential. It appears at Plus, where the cell is 9.
Saved chart layouts are 1, 5, 10, and then an infinity sign on Premium and an infinity sign on Ultimate. The hint says a layout keeps chart settings, indicators, drawings and symbols for one-click use later. One layout on Basic means one saved arrangement. Five on Essential is enough for a small set of markets. Ten on Plus is a larger set. Premium and Ultimate are the rows where the table stops printing a number and prints the infinity sign instead.
A few tools that people often assume are paid are marked available on Basic. The table marks 110+ drawing tools, Pine Script, candlestick pattern recognition, auto fib retracement, multi-timeframe analysis and symbol comparison as available on every plan, including Basic. Custom indicator templates are 1 on Basic and an infinity sign from Essential upward. The time limit for calculations is 20 seconds on Basic, 40 seconds on Essential, Plus and Premium, and 100 seconds on Ultimate. Pine itself is not the line that separates the free plan from Essential. The number of indicators on one chart is.
Other chart tools are gated, and the gate is not the same for each tool.
Custom intervals in minutes, hours, days, weeks and months start at Essential. The hint gives 90 minutes and 6 hours as examples. Basic does not have that row. Predefined second intervals start at Plus. Custom second intervals, any length in seconds, are Ultimate only. Tick-based intervals, bars that form after a set number of trades rather than after a set time, are Ultimate only. Custom range bars start at Essential. Intraday versions of price-based charts, named in the hint as Renko, Kagi, line break, and point and figure, start at Plus. Spread charts, a formula across symbols, start at Plus. Chart data export starts at Plus. The count of customizable chart types is 17 on Basic, Essential and Plus, and 21 on Premium and Ultimate.
Volume profile indicators start at Essential. Time price opportunity and volume footprint start at Plus. Volume candles start at Premium. Auto chart patterns start at Premium. The features page describes volume footprint, time price opportunity and session volume profile as chart types, without a plan name next to each one. The pricing table is where the plan name is attached.
Historical bars available, a separate row under Data, are 5K, 10K, 10K, 20K and 40K. The table prints the K. In ordinary numbers that is 5,000 on Basic, 10,000 on Essential and on Plus, 20,000 on Premium and 40,000 on Ultimate. The hint ties the larger store to study, scripts and the chart. It is not the same row as bar-replay history, which has its own limits by the minute, the second and the tick.
For a gold chart this section is mostly about screen space and about how many studies sit on XAUUSD at once. A daily chart and a weekly chart are two charts. That is the Essential cell, not the Basic cell. A daily, a 4-hour and a 1-hour, plus a second symbol, is four charts, which is the Plus cell. Eight and sixteen are Premium and Ultimate. None of those counts tells you where gold will trade. They tell you how much of the chart package is in use while you look.
Alerts, and how long they stay on
Alerts are three buckets on the pricing table, not one shared pile.
Active price alerts are 3 on Basic, 20 on Essential, 100 on Plus, 400 on Premium and 1,000 on Ultimate. Active technical alerts are unavailable on Basic, then 20, 100, 400 and 1,000. A technical alert, in the hint, is a notification when an indicator, a strategy, a drawing or a chart pattern meets a condition. Basic can run three price alerts and does not get that technical bucket. Essential is the first plan with both buckets, 20 in each.
Active watchlist alerts are unavailable on Basic, Essential and Plus. Premium lists 2. Ultimate lists 15. The hint says one alert's conditions can cover symbols in a watchlist. The features page describes the same idea, covering symbols in a watchlist with one alert, and does not print 2 or 15. Those two numbers are only on the pricing table.
Alert duration is 1 month on Basic, 2 months on Essential, 2 months on Plus, and an infinity sign on Premium and on Ultimate. The hint says regular alerts expire in two months, and that the longer feature keeps alerts running for as long as you need them. The "two months" in that sentence matches the Essential and Plus cells. The Basic cell says 1 month, which is shorter than the sentence. The infinity sign is the Premium and Ultimate cell, which is the row the hint is pointing at when it talks about alerts that keep running. A reader who wants an alert left on a weekly gold level for more than two months is reading the Premium cell, not the Essential cell.
Webhook notifications are unavailable on Basic and available from Essential upward. The features page says alerts can go to a browser, email, an app or a webhook, and that they run in the cloud. The pricing table is what marks the webhook line off for Basic.
Multi-condition alerts start at Plus. The features page says you can combine up to five settings, and it names price, drawings, indicators, chart values and custom logic. The pricing table marks the feature on or off and does not repeat the five. Second-based alerts also start at Plus. The hint says conditions on a second-based chart can be checked every second. Alerts on financial metrics start at Essential. Those are stock and crypto metrics in the hint, so they are a weak reason, on their own, for a gold chart to leave Basic.
Watchlists, next to alerts, are 1 on Basic and an infinity sign on every paid plan. Symbols per watchlist are 30 on Basic and 1,000 on each paid plan. Flagged-symbol colours are 1 on Basic and 7 on the paid plans. Import and export of a watchlist starts at Essential.
For a swing trader the alert question is usually about a handful of levels on one symbol, and about whether those alerts die in a month or in two. Three price alerts that last a month is the Basic cell. Twenty price alerts and twenty technical alerts that last two months is the Essential cell. For an intraday trader the question is more often about second-based alerts and about conditions that have to agree with each other. Both of those rows start at Plus. Watchlist-wide alerts, if the point is to scan many symbols with one condition, are a Premium and Ultimate row.
An alert is a message that a condition happened. It is not a filled order, and it is not a result. The count of alerts you are allowed to leave running is a plan limit. What gold does after the message arrives is the market.
Bar replay and intraday history
The pricing table groups replay and history under a Bar replay heading. Two rows are marked available on every plan, including Basic: Indicators replay, and Trading in bar replay. The indicator hint says you can replay the market with your indicators and see how they plotted as price moved. The trading hint says you can replay historical price action, pick a past date, and play bars at different speeds. The features page adds a description the pricing table does not split by plan: real and simulated trading on historical data, nine replay speeds, autoplay and a step-by-step mode, drawings and indicators during replay, and synchronized replay across charts. This post does not assign those nine speeds to a named plan, because the features page does not.
The history underneath that replay is split by bar size, and it is not "all history on every plan".
Historical data by the day and by higher timeframes is marked All on Basic, Essential, Plus, Premium and Ultimate. A daily, weekly or monthly gold chart is in that row on the free plan.
Historical data by the minute is unavailable on Basic. Essential's cell says 180 days, and the note on that cell says 6 months of 1-minute data, 12 months of 2-minute data, 18 months of 3-minute data, and so on. Plus's cell says 365 days, and its note says 1 year of 1-minute data, 2 years of 2-minute data, 3 years of 3-minute data, and so on. Premium and Ultimate say All, and their note says all intraday data available in TradingView's storage. The 180 and the 365 are the labels in the cells. The notes say the window grows as the minute bar gets larger. Treating "180 days" as a flat cap on every intraday chart would ignore the note that sits on the cell.
Historical data by the second is unavailable on Basic, Essential and Plus. Premium and Ultimate say All, and the note says all seconds-based data in TradingView's storage, starting from August 2022. The start date is part of the note. "All" here is all of that stored second data from August 2022, not a claim about seconds from earlier years.
Historical data by the tick is unavailable until Ultimate. Ultimate's cell says 7 days, and the note says 7 days of 1-tick data.
Put next to the interval rows from the chart section, the pattern is the same shape. You can place preset second bars on a chart from Plus. You can replay stored second history from Premium, and that store starts in August 2022. You can place a custom second interval, or a tick interval, on Ultimate, and the tick history that goes with it is seven days of 1-tick data.
Basic is the awkward row, and it is worth reading twice. Trading in bar replay is marked available, and minute history is marked unavailable. Day and higher history is marked All. A replay of a daily gold chart sits on the row that is open. A replay that needs 1-minute bars sits on the row that is closed. The table does not add a sentence that explains how the replay control behaves when the minute store is off. This post does not invent that sentence. It reports the two cells.
Intraday price-based charts, the Renko and related types on an intraday resolution, start at Plus, as the earlier section said. They are a chart-type limit, not a substitute for the second-history row. A Plus subscriber can put a preset second interval on a chart. The stored seconds used for a long replay are the Premium cell.
Deep backtesting, higher detail on historical bars, and an extra recalculation on each historical tick are marked on Premium and Ultimate in the strategy-testing section. They are off on Basic, Essential and Plus. Basic report metrics are on every plan. Advanced report metrics, and export of trades to CSV and of a report to XLSX, start at Essential. Someone testing a script on daily bars is not blocked by the Premium-only rows. Someone who wants the tick-by-tick recalculation the table describes is on Premium or Ultimate. A backtest on old bars is a calculation on old bars. It is not a record of what a live order would have paid, and this page does not treat it as one.
Ads, the desktop app and exchange data
Ad-free is two rows, Charts and Social network. Both are off on Basic and on from Essential through Ultimate. The hints say a chart without ads, and the social pages without ads. Basic is the plan that still carries them. From Essential up, the table marks both rows on. There is no higher plan that removes a further class of ad, because the table only has these two ad rows, and both flip at Essential.
The desktop app is a paid feature on this table. Desktop experience, native multi-monitor support, and tab linking by symbol between windows are all off on Basic and on from Essential upward. The multi-monitor hint says you can set up and restore a multi-monitor workspace without limits the browser may have. The features page says layouts, watchlists and settings sync across web, mobile and desktop, and it does not name the plan. The pricing table names it: the desktop rows start at Essential, not at Premium or Ultimate.
The four mobile rows are marked available on every plan, including Basic: the apps, full sync, native push alerts, and Android and iOS widgets. The desktop rows are the ones that stay off until Essential. A phone can carry a Basic login. A multi-monitor desktop workspace, on this table, stays off until Essential.
Exchange data is separate from the plan price. The questions on the pricing page say extra real-time and intraday data for exchanges, and they name NASDAQ, NYSE, NYSE Arca, OTC and CME as examples, can be added to the account. They also say you need a paid plan, or a trial, before you can add that data, and that the extra data works on the TradingView website for the person who bought it, not on TradingView widgets. The comparison table's caps on "maximum market data subscriptions" are unavailable on Basic, then 2 on Essential, 4 on Plus, 6 on Premium, and an infinity sign on Ultimate. Professional market data, a separate row, is Ultimate only.
This pricing page does not print the dollar price of those exchange add-ons. It points onward to a market-data page. Those add-on prices are not guessed here. The page also does not print a separate line for XAUUSD, for a spot gold feed, or for a gold futures contract. CME is named as an example of an exchange whose data can be bought on top. That is the whole of what the pricing page says about it. A reader who trades a gold futures symbol should read the data page for that exchange on the day, because the plan card will not show that charge.
Fastest data flow is marked off on Basic and on from Essential. Fundamental stock data, global economic data, hotlists, the economic and earnings calendars, and yield curves are marked on for every plan, including Basic. Unlimited access to all news sources starts at Essential. Historical annual financials are 7 years on Basic and 20 years on every paid plan. Quarterly financials are 8 years on every plan. Those rows matter for a share. They are a small part of a gold chart.
Simulated trading is marked available on every plan, including Basic, under the name the table uses. Broker connection is also marked available on every plan. This comparison does not name a broker. A chart login and a trading account are different decisions, and the plan table is only the first of them.
Customer support on the table is unavailable on Basic, Regular on Essential, Priority on Plus and on Premium, and First priority on Ultimate. The page does not print hours or a response time next to those words, so this post does not invent any.
Which TradingView plan fits gold swing trading?
Essential fits gold swing trading when you want a daily chart and a weekly chart together, and Basic still covers one daily chart with two indicators.
A swing trader on XAUUSD, in the ordinary sense of holding for days rather than for seconds, lives on daily and weekly bars, with the occasional look at a 4-hour chart after a large day. The pricing table's day-and-higher history is All on every plan. That part of the work does not require a paid row.
Basic covers one chart in the tab and two indicators. A daily gold chart with a moving average and one other study fits inside those two. Three price alerts last a month. There is one saved layout, ads stay on the chart, and the desktop app is off. Parallel connections stop at 2. For a person who opens one chart, checks the level, and leaves, that is the whole of the free column.
Essential is the step up when that one chart is no longer the workflow. Two charts per tab cover a daily and a weekly, or gold and a second market, with the symbol sync the hint describes. Five indicators replace two. Volume profile turns on. Custom minute and hour intervals turn on, so a 90-minute or a 6-hour chart is allowed. Five layouts replace one. Price alerts go from 3 to 20, technical alerts appear at 20, and the duration cell says 2 months rather than 1. Ads come off the chart and off the social pages. The desktop app and native multi-monitor support turn on. Parallel connections go from 2 to 10. The minute-history cell opens, with the 180-day label and the scaled note. Stacking one indicator on another stays at 1, the same as Basic. Preset second bars stay off. Second history stays off.
That is a coherent paid plan for a swing workflow, and it is the first paid card. Plus, Premium and Ultimate add charts, alerts and intraday stores a daily process may never open. Paying for eight charts and a second-by-second archive, in order to keep a daily and a weekly gold chart, buys rows the daily chart does not read. The special price on Essential, with Annually selected, was $12.95 a month and $155.40 for the year. Plus was $29.95 and $359.40. The difference on the notes is $204 a year. That difference is worth paying when the extra rows are in use. It is an idle fee when they are not.
A second metal is a reason some swing traders want the second chart or a second layout. How gold and silver differ as holdings, including premiums, tax and storage, is a different subject from a chart plan, and it is set out in gold vs silver. A chart of the price is also not the same object as a bar or a coin in a safe. The purchase, the premium and the storage are in how to buy physical gold, and the choice between a bar and a coin is in gold bars vs gold coins. None of those three pages is a reason to pick Premium over Essential. They are a reason to keep the chart and the metal distinct.
The live price, the calendar and the positioning reports sit on Baroq Markets. Baroq's own plans, which are a desk and research product and not a chart login, are on the pricing page.
Which TradingView plan fits intraday gold trading?
Plus is the first plan with preset second bars and a year of 1-minute history, Premium adds stored second-by-second history, and Ultimate adds tick bars.
An intraday trader on gold is using the rows the swing trader can ignore. The question is which of those rows, because they do not all turn on at the same plan.
Plus is the first plan with preset second intervals, second-based alerts, multi-condition alerts, intraday price-based charts, volume footprint and time price opportunity. Charts per tab go to 4. Indicators per chart go to 10, and indicators on indicators go to 9, so a stack that Essential refuses is allowed. Price alerts and technical alerts go to 100 each. Alert duration stays at 2 months, the same cell as Essential. Minute history is the 365-day cell, with the note that 1-minute data is a year, 2-minute data is two years, and 3-minute data is three years. Second-by-second history is still off. Tick history is still off. Saved layouts go to 10. Parallel connections go to 20. The special price, Annually selected, was $29.95 a month and $359.40 for the year.
Premium is the plan that opens the second store. The cell says All, and the note says the stored seconds start from August 2022. Charts per tab go to 8, indicators to 25, indicators on indicators to 24. Price alerts and technical alerts go to 400. Alert duration becomes the infinity sign, so a condition can stay on past the two months printed on Plus. Watchlist alerts appear, at 2. Volume candles and auto chart patterns turn on. Historical bars go from 10K to 20K. The deep-testing and tick-recalculation rows in the strategy section turn on. Custom second intervals and tick intervals stay off, because those two are Ultimate. The special price was $59.95 a month and $719.40 for the year, against $839.40 for a year of monthly payments.
Ultimate is the plan for the rows that are still closed. Sixteen charts per tab, 50 indicators, 49 indicators stacked on indicators, 1,000 price alerts and 1,000 technical alerts, 15 watchlist alerts, an infinity sign on saved layouts, 200 parallel connections, 40K historical bars. Custom second intervals. Tick-based intervals. Seven days of 1-tick data. Professional market data. A 100-second calculation limit, against 40 seconds on Premium. Market-data subscription slots go from 6 to the infinity sign. The special price was $199.95 a month. The note says $2,399.40 for the year, against $2,879.40 if the same year is paid monthly. The gap on that note is $480. The support cell says First priority, without a stated response time.
A practical way to choose, using only those cells:
- If the working chart is 1-minute or 5-minute, and preset seconds are enough, start the comparison at Plus. The minute-history note on Plus is the one that spells out a year of 1-minute data.
- If the work is a replay of second bars, or alerts that must stay on with no expiry date in the cell, the table puts that at Premium. Remember the August 2022 start on the second-history note.
- If the work is a tick chart, or a custom second length, or more than eight charts in one tab, the table puts that at Ultimate, and the tick store is seven days.
- If the exchange wants a separate real-time fee, the plan cap is 4 subscriptions on Plus, 6 on Premium and the infinity sign on Ultimate, and the dollar amount of the feed is not on this pricing page.
- Read the card again on the day you pay. The figures in this post are from 10 November 2026.
The same trader should keep the daily levels in view, because an intraday chart of gold still sits inside a larger move. That larger move is what the day-and-higher row already gives every plan, including Basic. Paying for Ultimate does not replace a look at the weekly chart. It adds tick data and more panes.
Baroq's plans for the desk and the research around that work are separate from this chart login. See plans.
Where these figures were checked
Each source below was opened on 10 November 2026. If TradingView changes a card or a cell, the page they publish wins over this post.
- TradingView, Subscriptions: Pricing and FeaturesPartner. The five plan names, the $0 card, the Annual button that was checked, the "Save up to 17%" badge, the special prices, the yearly notes, the comparison table (charts, indicators, layouts, alerts, bar replay, ads, desktop and data caps), and the answers on cancel, refunds, upgrades, downgrades and extra exchange data.
- TradingView, FeaturesPartner. The general descriptions: up to 16 charts per screen, custom intervals including seconds and range bars, bar replay with nine speeds, autoplay, step-by-step mode and synchronized multi-chart replay, alerts in the cloud with up to five conditions, watchlist alerts, 400+ built-in indicators, 100,000+ public indicators, and 110+ drawing tools. This page does not assign those descriptions to Essential, Plus, Premium or Ultimate. The assignment is on the pricing table.
Join the free Telegram channel: https://t.me/baroqtech
Educational content, not financial advice. Prices, fees and offers change: check them on the provider's own site before you sign up. Trading leveraged products carries a high risk of losing money, and you can lose all of it.